Category: Industry Tips

  • Fleet Tracking for Construction Equipment and Assets

    Fleet Tracking for Construction Equipment and Assets

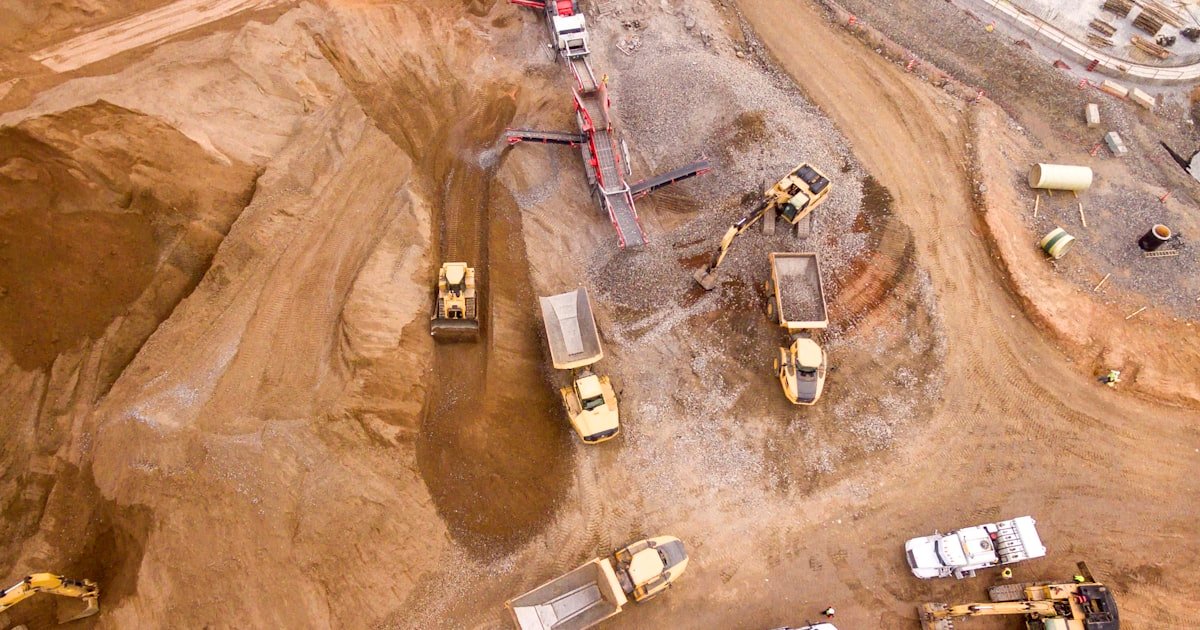
    A single excavator can be worth more than a whole fleet of vans - and it’s a lot easier to steal, misuse or simply lose track of across a dozen sites. Construction equipment tracking uses GPS and telematics to keep eyes on every machine, trailer and generator you own, wherever it’s parked. This guide explains how tracking protects high-value assets, controls fuel and idling, proves machine hours, and keeps utilisation high across sites.

    Why construction fleets are hard to manage

    Construction assets create problems that ordinary vehicle fleets don’t. Equipment sits on open, unsecured sites overnight. Machines move between projects and get forgotten. Some assets - trailers, generators, compressors - have no engine or driver at all. And expensive plant is a prime target for theft, with recovery rates notoriously low.

    The result is a fleet that’s valuable, scattered and easy to lose visibility of. GPS tracking brings all of it onto one map: powered machines, towed equipment and static assets alike. If you’re new to the category, our guide to what fleet management is covers the fundamentals that apply here too.

    Protecting high-value equipment from theft

    Plant theft is expensive and demoralising: you lose the asset, the project stalls, and insurance rarely covers the full disruption. Tracking is the most effective deterrent and recovery tool available.

    • Geofencing - draw a boundary around each site and get an instant alert if a machine leaves it, especially outside working hours.
    • Remote engine cut / immobiliser - stop a stolen machine from being driven or loaded onto a truck.
    • Movement alerts - be notified the moment an asset moves when it shouldn’t, day or night.
    • Live recovery location - if equipment is taken, give police an exact, current position.

    Geofencing is the workhorse here - our explainer on geofencing for fleets shows how to set up zones that alert you before an asset disappears.

    Controlling fuel and idling costs

    Heavy equipment drinks fuel, and a surprising amount of it is wasted. Machines left idling between tasks, or running when no work is happening, burn diesel and rack up engine hours that bring servicing forward. Tracking makes this visible.

    With idle-time reporting you can see which machines and sites waste the most, then set expectations to shut down between tasks. It’s the same principle behind broader fleet cost-cutting: you can’t reduce what you can’t measure.

    Proving machine hours and utilisation

    Engine-hour data does more than schedule maintenance - it tells you whether you actually need all the equipment you own. Tracking usage per machine reveals the assets that earn their keep and the ones sitting idle that could be redeployed, rented out or sold.

    Data point What it tells you
    Engine / working hours When to service and how hard an asset is used
    Utilisation rate Whether you’re over- or under-equipped
    Idle time Fuel waste and unnecessary engine wear
    Location history Which site an asset was on, and when
    Movement outside hours Possible theft or unauthorised use

    Accurate machine-hour records also support billing and hire agreements, and cut disputes over how long a piece of plant was on site.

    Maintenance and uptime

    A machine that breaks down mid-project can hold up an entire crew. Because engine hours drive most plant servicing, tracking lets you schedule maintenance on real usage instead of guesswork - servicing before a failure rather than after. That means fewer breakdowns, longer asset life and less expensive emergency downtime.

    Managing equipment across multiple sites

    Few construction businesses run a single job. Machines and assets move between projects, get borrowed by one crew from another, and occasionally end up parked at a site that finished weeks ago. Without a central view, keeping track of what’s where turns into a daily round of phone calls - and the answer is often wrong.

    A live map ends the guesswork. You can see at a glance which assets are on which site, spot equipment that’s been idle at a completed job and could be redeployed, and confirm a machine actually arrived where it was dispatched. That visibility feeds directly into utilisation: instead of buying or hiring another excavator, you may find you already own one sitting unused across town. For a broader look at trimming costs this way, see our guide to cutting fleet costs without cutting vehicles.

    What to look for in construction asset tracking

    Construction is tougher on hardware and more varied than a van fleet, so choose accordingly:

    1. Rugged, flexible hardware - devices that suit both powered machines and unpowered assets like trailers and generators.
    2. Strong geofencing and theft alerts - site boundaries and out-of-hours movement notifications.
    3. Remote immobilisation - the single most effective anti-theft feature for high-value plant.
    4. Engine-hour and idle reporting - for maintenance, utilisation and fuel control.
    5. Mobile apps - so you can check any asset from any site.
    6. Managed hardware - device, SIM and installation handled across a mixed fleet.

    How Fleetile fits construction fleets

    Fleetile puts every machine, trailer and generator on one live map, with geofencing around sites, remote engine cut for theft protection, movement and idling alerts, engine-hour reporting for maintenance and utilisation, and 30+ smart alerts - all in iOS and Android apps with managed hardware. Whether an asset has an engine or not, you can see where it is, how it’s used and whether it’s earning its keep.

    Frequently asked questions

    Can you track equipment that has no engine, like trailers or generators?

    Yes. Battery-powered or self-contained tracking devices can be fitted to unpowered assets such as trailers, generators and compressors, so they appear on the same map as your machines and vehicles.

    How does tracking prevent construction equipment theft?

    Geofencing alerts you when a machine leaves a site, remote engine cut stops a stolen machine from being driven or loaded, and live location supports fast recovery. Together they deter theft and dramatically improve the odds of getting an asset back.

    How does equipment tracking help with maintenance?

    Most plant is serviced on engine hours. Tracking records real usage per machine, so you can schedule maintenance on actual hours rather than guesswork - reducing breakdowns and extending asset life.

    Is tracking worth it for a small plant fleet?

    Yes. Even a few machines represent significant value, and a single prevented theft or avoided breakdown often covers the cost. Better utilisation and fuel control add ongoing savings on top.

    See construction tracking in action

    The clearest way to judge equipment tracking is to see it running on real assets. Get a Fleetile demo and watch geofencing, theft alerts and utilisation reporting come together on one dashboard.

  • GPS Tracking for Logistics and Delivery Fleets

    GPS Tracking for Logistics and Delivery Fleets

    In logistics and delivery, everything hinges on one question: where is the load right now? GPS tracking for logistics answers it in real time, turning a fleet of vans and trucks from a black box into a live map you can plan around. This guide covers exactly how delivery operations use GPS tracking to sharpen ETAs, cut fuel, prevent theft and prove every drop - plus what to look for when you choose a system.

    Why logistics fleets need GPS tracking

    Delivery is a business of promises: a package by a certain time, to a certain place, in one piece. Without visibility, every one of those promises is a guess. A driver hits traffic and nobody knows until the customer calls. A parcel is “delivered” but the recipient disputes it. Fuel spend creeps up and no one can say why.

    GPS tracking closes those gaps. With live location on every vehicle, dispatchers can see delays as they happen, reroute around them, give customers accurate ETAs and prove exactly when and where a delivery was made. It’s the same foundation as any fleet management setup, tuned for the pace and pressure of last-mile work.

    How GPS tracking improves delivery operations

    Accurate ETAs and fewer “where’s my order?” calls

    Live location lets you give customers realistic delivery windows and update them when things change. That alone cuts a huge volume of support calls and the driver interruptions that come with them.

    Smarter routing and dispatch

    When you can see the whole fleet at once, you assign the nearest available vehicle to a new pickup instead of the one that “usually” does that area. Over hundreds of stops a day, shorter routes mean real fuel and time savings.

    Proof of delivery and dispute resolution

    Trip history shows exactly where a vehicle was at any moment. When a customer claims a parcel never arrived, timestamped location data settles it in seconds instead of eating an afternoon.

    Lower fuel costs

    Idling, detours and unauthorised trips quietly inflate fuel bills. Tracking surfaces all three, and pairing it with driver behaviour monitoring tackles the aggressive driving that burns even more.

    Security: protecting high-value loads

    Delivery vehicles carry valuable, easily resold cargo, which makes them targets. GPS tracking is your first line of defence, and the right features turn it into active protection:

    • Geofencing - draw zones around depots, customer sites and routes, and get alerted the moment a vehicle enters or leaves where it shouldn’t.
    • Remote engine cut - immobilise a stolen or hijacked vehicle remotely so it can’t be driven away.
    • Real-time theft alerts - instant notification of unauthorised movement, ignition-on out of hours, or a device going offline.
    • Fast recovery - if the worst happens, live location gives you and the authorities a precise position.

    To understand how zones and alerts work together, see our explainer on geofencing for fleets.

    The numbers that matter for delivery fleets

    GPS data turns fuzzy operations into measurable ones. The metrics logistics managers watch most:

    Metric Why it matters
    On-time delivery rate The core promise to customers; drives retention
    Stops per route Route density directly affects cost per delivery
    Idle time Wasted fuel and a sign of routing or dwell problems
    Distance per delivery Reveals inefficient routing and detours
    Unauthorised trips Fuel leakage and misuse of company vehicles

    From reactive to proactive dispatch

    The biggest shift GPS tracking brings to a delivery operation isn’t any single feature - it’s moving from reacting to problems to preventing them. Without visibility, a dispatcher spends the day fielding surprises: a late driver, a missed pickup, a customer complaint. With a live map, those same events are visible while there’s still time to act. A vehicle stuck in traffic can be rerouted, a nearby driver reassigned to an urgent job, and the affected customer told before they even notice.

    Over weeks, that proactive stance compounds. Trip and idle reports show which routes consistently run long, which delivery windows are unrealistic, and where dwell time at stops is eating the schedule. Feed those findings back into planning and each route gets a little tighter, which is exactly the kind of continuous improvement that separates a profitable delivery operation from one that just breaks even.

    What to look for in a logistics GPS system

    Delivery work is demanding, so not every consumer-grade tracker will cut it. Prioritise:

    1. Real-time updates - location every few seconds, not minutes, so dispatch decisions are based on now.
    2. Strong geofencing and alerts - for depots, delivery zones and out-of-hours movement.
    3. Remote immobilisation - essential for protecting high-value cargo.
    4. Trip history and reporting - for proof of delivery, disputes and route analysis.
    5. Mobile apps - so dispatchers and managers can run the fleet from anywhere.
    6. Managed hardware - device, SIM and installation handled, so a growing fleet is easy to onboard.

    These are exactly the areas where purpose-built fleet platforms pull ahead of cheap plug-in trackers - a gap we break down in GPS fleet tracking vs consumer car trackers.

    How Fleetile supports delivery fleets

    Fleetile gives logistics operators live GPS tracking with second-level updates, geofencing around depots and delivery zones, remote engine cut for cargo security, driver scoring, trip history for proof of delivery, and 30+ smart alerts - all in iOS and Android apps, with managed hardware so scaling the fleet is straightforward. Whether you run ten vans or a few hundred, the whole operation lives on one map.

    Frequently asked questions

    How does GPS tracking improve delivery times?

    Live location lets dispatchers spot delays, reroute around traffic and assign the nearest vehicle to each job. Better routing and accurate ETAs mean more on-time deliveries and fewer customer calls chasing orders.

    Can GPS tracking provide proof of delivery?

    Yes. Trip history records exactly where and when each vehicle stopped, so timestamped location data can confirm a delivery was made and resolve disputes quickly.

    How does GPS tracking protect against cargo theft?

    Geofencing alerts you to unauthorised movement, remote engine cut lets you immobilise a stolen vehicle, and live location supports fast recovery. Together they turn tracking into active theft prevention rather than just monitoring.

    Is GPS tracking worth it for a small delivery fleet?

    Yes. Even a handful of vehicles benefit from better routing, lower fuel costs, proof of delivery and theft protection. Savings on fuel and disputes typically cover the cost well before the fleet grows.

    See it on your delivery fleet

    The best way to judge GPS tracking for logistics is to watch it run. Get a Fleetile demo and see live tracking, geofencing and proof of delivery working on a real fleet.

  • The Real ROI of Fleet Tracking (With Example Numbers)

    The Real ROI of Fleet Tracking (With Example Numbers)

    Every fleet owner asks the same question before buying: is this actually worth it? Calculating fleet tracking ROI isn’t guesswork - the savings come from a handful of predictable areas, and you can estimate your own payback with a few numbers you already have. This guide explains where the returns come from, walks through a worked example with illustrative figures, and shows you how to run the maths for your own fleet. (The numbers below are examples to show the method, not a quote - your results depend on your fleet.)

    What “ROI” means for a fleet

    Return on investment is simply the value you get back compared with what you spend. For fleet tracking, the spend is the hardware and subscription; the return is the money saved across fuel, maintenance, insurance, admin and theft. ROI is usually expressed as a percentage or, more usefully, as a payback period - how many months until the savings cover the cost.

    The formula is straightforward:

    • Monthly saving = fuel saved + maintenance saved + accident saved + admin saved + theft avoided
    • Payback (months) = total cost ÷ monthly saving
    • Annual ROI = (yearly saving − yearly cost) ÷ yearly cost

    The trick is estimating each saving realistically. Let’s break them down.

    Where the savings come from

    Fuel

    Usually the biggest and fastest win. Reducing idling, speeding and detours - plus catching fuel theft - commonly trims a noticeable slice off the fuel bill. Even a modest percentage reduction is significant because fuel is often the largest controllable cost.

    Maintenance

    Switching from reactive repairs to scheduled, mileage-based servicing avoids expensive breakdowns and extends vehicle life. Fewer roadside emergencies means fewer tows, less downtime and lower repair bills.

    Accidents and insurance

    Safer driving means fewer accidents, and fewer accidents mean lower repair costs and a better risk profile at renewal. Telematics data also helps you contest false claims. Because a single serious accident is so costly, even a small reduction in incident rate has an outsized effect.

    Admin and disputes

    Automated trip history, mileage and working-hours reports replace manual logging and settle customer disputes with a route replay. The saved hours are real payroll money.

    Theft prevention

    Harder to predict, but a single prevented theft - via geofencing alerts and remote engine cut - can outweigh a whole year of tracking cost on its own.

    A worked example

    Let’s take an illustrative fleet of 10 vehicles. The figures below are examples chosen to demonstrate the method - plug in your own real numbers to get a meaningful result.

    Saving area How it’s estimated Example monthly saving (10 vehicles)
    Fuel ~8% off a $4,000 fuel bill $320
    Maintenance Fewer breakdowns, planned service $150
    Accidents / insurance Reduced incident rate (annualised) $120
    Admin time ~5 hours/week saved $100
    Total $690 / month

    In this example the fleet saves roughly $690 a month before even counting theft prevention. If the tracking subscription and hardware amortisation came to, say, $250 a month for 10 vehicles, the net gain is around $440 a month - and the system pays for itself well inside the first few months. Add one prevented theft over the year and the ROI climbs sharply.

    The point isn’t the exact numbers - it’s the structure. Once you see the categories, you can drop in figures from your own operation and get a realistic payback estimate.

    How to calculate your own ROI in 4 steps

    1. Gather your baseline. Pull your current monthly fuel bill, maintenance spend, insurance cost, and the hours spent on fleet admin.
    2. Apply conservative saving rates. Estimate a modest reduction for each area - it’s better to under-promise. Even cautious figures usually add up.
    3. Total the monthly saving and compare it with the tracking cost. For a sense of what tracking typically costs, see our fleet GPS tracking cost guide.
    4. Divide cost by saving to get your payback period in months. Anything under a year is a strong case.

    If you want to go deeper on any single lever, our guide on how to cut fleet costs without cutting vehicles breaks down each saving area in detail.

    Beyond the spreadsheet: the returns you can’t easily price

    Some of the biggest benefits don’t fit neatly in a table but matter enormously:

    • Peace of mind - knowing where every vehicle is, right now.
    • Better customer service - accurate arrival times and proof of delivery.
    • Faster recovery - locating and immobilising a stolen vehicle in minutes.
    • Better decisions - real utilisation data instead of guesswork.

    These “soft” returns often become the reasons owners say they’d never go back, even though they’re the hardest to put a dollar figure on.

    How Fleetile maximises your return

    The size of your return depends on how much of the waste you can actually see and act on. The Fleetile platform pulls every ROI lever together: live GPS tracking that updates every few seconds, driver scoring, geofencing, trip history and reports, 30+ smart alerts, and remote engine cut - all in one dashboard with iOS and Android apps and managed hardware. The more of the picture you can see, the more waste you can remove, and the faster the system pays for itself.

    Frequently asked questions

    Is fleet GPS tracking worth the money?

    For most fleets, yes. The combined savings from fuel, maintenance, accidents and admin typically cover the cost within months, and prevented theft can pay for the whole year in a single event. The best way to be sure is to run the numbers on your own fleet using conservative estimates.

    How long until fleet tracking pays for itself?

    It varies by fleet, but many owners see payback within the first few months. Fuel and admin savings tend to appear quickly, while maintenance and insurance savings build over the following quarters.

    Which saving is the most reliable?

    Fuel is usually the most predictable and fastest to appear, because reducing idling, speeding and detours produces measurable results almost immediately. It’s a sensible anchor for any ROI estimate.

    Do the example numbers apply to my fleet?

    No - they’re illustrative, meant to show how the calculation works. Your real payback depends on your fuel spend, vehicle types, driving patterns and current inefficiencies. Use the four-step method above with your own baseline figures.

    Calculate your real return

    The clearest way to see the ROI is to watch your own vehicles, fuel use and alerts on one live dashboard, then run the numbers. Get a Fleetile demo and see exactly where the savings - and the payback - will come from.

  • How to Cut Fleet Costs Without Cutting Vehicles

    How to Cut Fleet Costs Without Cutting Vehicles

    When budgets get tight, the first instinct is often to shrink the fleet - park vehicles, cancel routes, cut capacity. But removing vehicles removes earning power, and it rarely fixes the real problem: waste. If you want to reduce fleet costs without losing the ability to serve customers, the smarter move is to make every vehicle you already own cheaper to run. This guide breaks down where fleet money actually leaks and how to plug each hole with better data instead of fewer vehicles.

    Where fleet money really goes

    Before cutting anything, it helps to know what you’re spending on. For most fleets the cost stack looks roughly like this:

    Cost area Typical driver of waste Main lever to fix it
    Fuel Idling, speeding, detours, theft Tracking + driver scoring
    Maintenance Reactive repairs, missed service Scheduled, mileage-based servicing
    Insurance Accidents, poor risk profile Safer driving, telematics evidence
    Labour & admin Manual logs, disputes, overtime Automated reports
    Depreciation Over-utilised or idle assets Right-sizing from usage data

    Notice that “too many vehicles” isn’t the top line. The biggest savings usually come from running each vehicle better - and that starts with visibility.

    1. Attack fuel first - it’s the fastest win

    Fuel is typically the largest controllable cost, which makes it the best place to start. Three habits quietly inflate it:

    • Idling - engines running while going nowhere burn fuel for zero output.
    • Aggressive driving - harsh acceleration and speeding wreck efficiency.
    • Detours and theft - off-route trips and skimmed fuel add up fast.

    Live GPS tracking plus driver scoring exposes all three. You can see which vehicles idle the most, which drivers drive hardest, and which trips wander off route. Coaching the bottom few drivers often produces a visible drop in fuel spend within a month or two. If you suspect deliberate loss, our guide on how to reduce fuel theft in your fleet covers the specific controls to add.

    2. Switch maintenance from reactive to scheduled

    A breakdown costs far more than a service: towing, emergency repairs, a vehicle off the road, missed jobs, and often a knock-on to other vehicles covering the gap. Because your tracking system logs accurate mileage automatically, you can schedule servicing by real distance driven rather than guesswork. Catching a worn part on a planned service is cheap; catching it on the roadside is not. Planned maintenance also extends vehicle life, pushing back the biggest cost of all - replacement.

    3. Lower insurance and accident costs with safer driving

    Accidents are expensive twice: the immediate repair and injury costs, and the long tail of higher premiums. Driver behaviour monitoring reduces both. When drivers know that speeding and harsh braking are scored, the risky behaviour drops - and fewer incidents mean a better risk profile at renewal. Telematics data also gives you evidence to contest false or exaggerated claims, which protects your premiums further.

    4. Cut admin and dispute costs with automated reports

    Manual logs, paper timesheets and “he said, she said” disputes quietly eat hours every week. When trip history, mileage, working hours and stops are recorded automatically, a lot of that overhead simply disappears:

    • Timesheets reconcile against actual vehicle activity.
    • Customer disputes (“your driver never arrived”) are settled with a route replay.
    • Monthly reporting becomes a download, not a data-entry project.

    The saved hours are real money, and the reduced disputes protect both revenue and customer relationships.

    5. Right-size using real utilisation data

    This is where you can trim capacity intelligently, if the data supports it. Instead of guessing which vehicles are underused, look at actual utilisation: which assets sit idle most of the week, which routes overlap, where a shared pool would work. Sometimes the answer is redeploying a vehicle rather than removing it. Either way, the decision is based on evidence, not gut feel - and you keep the capacity you actually need.

    6. Reduce theft and recovery costs

    A stolen vehicle is a catastrophic, one-off cost that also disrupts operations for days. Geofencing alerts you the moment a vehicle leaves where it should be, and for high-value assets, remote engine cut and immobilisation let you stop a vehicle before it disappears. Preventing a single theft can outweigh a whole year of tracking costs.

    The compounding effect

    No single change transforms a fleet budget, but they stack. A little less idling, a few avoided breakdowns, one prevented accident, a couple of hours saved on admin each week, and one theft averted - together they add up to meaningful savings without parking a single vehicle. To understand the payback more precisely, see our breakdown of the real ROI of fleet tracking.

    How Fleetile pulls it together

    Every lever above runs on the same foundation: accurate, real-time data in one place. The Fleetile platform combines live GPS tracking, driver scoring, geofencing, trip history and reports, 30+ smart alerts, and remote engine cut - with iOS and Android apps and managed hardware so rollout is simple. Instead of five disconnected tools, you get one dashboard that shows exactly where the money is going and where to trim the waste.

    Frequently asked questions

    What’s the biggest cost saving from fleet tracking?

    Fuel is usually the fastest and largest win because idling, speeding and detours are common and easy to fix once you can see them. Over the longer term, avoided accidents and planned maintenance often deliver just as much, plus the occasional prevented theft.

    Can I cut costs without reducing the number of vehicles?

    Yes - that’s the whole point. Most fleet waste comes from how vehicles are run, not how many you have. Reducing fuel waste, servicing on schedule, improving driver safety and automating admin lowers your cost per vehicle while keeping full capacity.

    How does driver behaviour affect fleet costs?

    Aggressive driving burns more fuel, wears out brakes and tyres faster, and causes more accidents. Scoring and coaching drivers therefore cuts fuel, maintenance and insurance costs at the same time, which is why it’s one of the highest-leverage changes you can make.

    How soon will I see savings?

    Fuel and admin savings often appear within the first one to two months, driven partly by the behaviour change that comes from vehicles being tracked. Maintenance and insurance savings build over the following quarters as planned servicing and safer driving take effect.

    See where your fleet is leaking money

    The clearest way to find savings is to watch your own vehicles, idling, routes and alerts on one live dashboard. Get a Fleetile demo and see exactly where you can cut fleet costs without cutting a single vehicle.

  • 7 Ways to Reduce Fuel Theft in Your Fleet

    7 Ways to Reduce Fuel Theft in Your Fleet

    Fuel is one of the largest line items in any fleet budget, and it’s also one of the easiest to skim. If you want to reduce fuel theft in your fleet, the good news is that most of it hides in plain sight: padded fuel receipts, off-route detours to a friend’s car, tank siphoning overnight, and “ghost” refills that never went into a company vehicle. With GPS tracking and a few disciplined habits, you can spot the pattern quickly and close the gaps. This guide walks through seven practical ways to do exactly that.

    Why fuel theft is so common (and so hard to see)

    Fuel theft rarely looks like theft. It usually looks like a slightly higher fuel bill, a receipt that’s a little too round, or a tank that’s emptier than the mileage suggests. Because each incident is small, it slips past manual checks. Multiply a few skimmed litres per week across a fleet of vehicles and it becomes real money leaking out every month.

    The common forms of fuel loss are:

    • Fuel card fraud - refuelling a personal vehicle, or buying fuel and reselling it.
    • Receipt padding - claiming more litres than were actually pumped.
    • Tank siphoning - physically drawing fuel from a parked vehicle.
    • Idling and unauthorised trips - burning company fuel on personal errands.
    • Inefficient routing - longer routes that quietly inflate consumption.

    The fix is visibility. When you can match every fuel purchase to a real vehicle at a real place and time, theft has nowhere to hide.

    7 ways to reduce fuel theft in your fleet

    1. Cross-check every fuel receipt against GPS location

    This is the single most powerful control. When a fuel purchase is logged, ask one question: was the vehicle actually at that fuel station, at that time? With live GPS tracking that updates every few seconds, you can replay the trip history and confirm it instantly. If the receipt says a station across town but the vehicle was parked at the depot, you’ve found your leak. Make this a routine spot-check and word gets around fast.

    2. Set geofences around fuel stations and depots

    Geofencing lets you draw virtual boundaries on a map and get alerted when a vehicle enters or leaves. Put a geofence around the approved fuel stations and your depot. Now a fuel purchase with no matching “entered fuel station” event is an immediate red flag - because the vehicle was never there. Geofences also catch the reverse problem: a vehicle sitting at a station far longer than a fill-up should take.

    3. Monitor overnight and parked-vehicle activity

    Siphoning usually happens when nobody is watching - overnight, on weekends, in a quiet yard. Smart alerts can notify you when a parked vehicle’s engine starts unexpectedly, when it moves outside working hours, or when it leaves a geofence at 2am. A vehicle that “wakes up” when it should be asleep is worth investigating.

    4. Use driver scoring to cut idling and aggressive driving

    Not all fuel loss is theft - a lot of it is waste, and waste is easier to fix. Excessive idling, harsh acceleration and speeding all burn extra fuel. Driver scoring grades each driver on these behaviours, so you can coach the worst offenders and reward the best. Reducing idle time alone often produces a visible drop in the monthly fuel bill.

    5. Flag off-route and unauthorised trips

    A vehicle that regularly detours off its assigned route is either lost, moonlighting, or making personal stops on company fuel. Trip history and route replay make these detours obvious. Set alerts for trips outside working hours or outside the operating area, and review any vehicle whose mileage keeps climbing without matching deliveries.

    6. Reconcile fuel volume against distance driven

    Every vehicle has a rough, predictable fuel-per-distance figure. When the fuel purchased suddenly outpaces the distance driven, something is off - either fuel is going into another tank, or receipts are being padded. Because your tracking system already logs accurate mileage, this reconciliation becomes a simple monthly report rather than a guessing game.

    7. Make it visible that you’re watching

    Deterrence is cheaper than investigation. When drivers know that every trip, stop and fuel purchase is logged and reviewed, casual theft drops sharply. You don’t need to catch everyone - you need everyone to believe they could be caught. A short briefing that “all vehicles are GPS tracked and fuel is reconciled monthly” often pays for itself.

    Detection method comparison

    Different controls catch different kinds of loss. A layered approach works best:

    Method Catches Effort to set up
    GPS receipt cross-check Card fraud, ghost refills Low
    Geofencing fuel stations Off-site purchases Low
    Overnight activity alerts Siphoning, unauthorised use Low
    Driver scoring Idling and driving waste Medium
    Fuel-vs-distance reconciliation Receipt padding Medium

    How Fleetile helps you stop fuel theft

    Every control above depends on accurate, real-time data. The Fleetile platform gives you live GPS tracking that updates every few seconds, geofencing with instant entry and exit alerts, driver scoring, full trip history and route replay, and 30+ smart alerts you can tune to your working hours. For high-risk vehicles, remote engine cut and immobilisation add a physical layer of protection on top of the reporting. It all runs from one dashboard and from the iOS and Android apps, so you can check a suspicious purchase from your phone in seconds.

    If controlling fuel is part of a wider push to cut fleet costs, tackling theft and waste together tends to deliver the fastest, most visible savings.

    Frequently asked questions

    How can GPS tracking prove fuel theft?

    GPS tracking records where each vehicle was at any moment. By matching a fuel receipt’s time and location against the vehicle’s actual position, you can confirm whether the fuel really went into that vehicle. Mismatches - a purchase where the vehicle was never present - are strong evidence of fraud.

    Does geofencing stop fuel theft on its own?

    Geofencing doesn’t physically block theft, but it makes it visible. Alerts when vehicles enter or leave fuel stations, depots or their operating area help you spot purchases and movements that don’t add up, which is usually enough to deter casual theft and catch repeat offenders.

    What’s the difference between fuel theft and fuel waste?

    Theft is fuel deliberately taken - siphoning, card fraud, personal trips. Waste is fuel burned unnecessarily through idling, speeding or poor routing. Both inflate your fuel bill, and a good tracking system helps you reduce each: theft through location checks and alerts, waste through driver scoring and route optimisation.

    How quickly can I see results?

    Many fleets see a measurable drop in fuel spend within the first month or two, largely because drivers behave differently once they know trips and purchases are tracked and reconciled. The deterrent effect is immediate; the reporting refines savings over time.

    See it on your own fleet

    The fastest way to understand how much fuel you could be losing is to watch your vehicles, fuel stops and alerts on one live dashboard. Get a Fleetile demo and see exactly how tracking, geofencing and alerts close the gaps that let fuel theft happen.

  • Route Playback: The Black Box Your Fleet Has Been Missing

    Route Playback: The Black Box Your Fleet Has Been Missing

    When a customer claims their delivery never arrived, when an accident report does not match the driver’s account, when you simply need to know what happened on a specific day - route playback gives you the answer. Here is what it is, how it works, and the situations where it proves its value.

    Aircraft have black boxes. Commercial vehicles have route playback.

    The difference is that aircraft black boxes are only examined after disasters. Route playback in Fleetile is something you use every week - for coaching, for dispute resolution, for performance review, and for understanding your operation at a level that is simply not possible without it.

    What Route Playback Actually Shows

    Route playback in Fleetile is not just a line on a map. When you replay a trip, you see:

    • The exact route taken, second by second
    • Speed at every point along the route
    • Time spent at each stop, with the address
    • Where harsh braking, acceleration, or speed violations occurred (marked on the route)
    • The full timeline - when the engine started, when it stopped, every event in sequence

    You control the playback speed. At 1× speed you see the trip in real time. At 8× you can review a full day’s driving in minutes. You can pause at any point and examine the map position, speed, and any events at that exact moment.

    Dispute Resolution

    This is the most common reason operators turn to route playback for the first time.

    A customer calls to say their delivery arrived two hours late. The driver says there was traffic. Route playback shows the vehicle parked for 90 minutes three kilometres from the delivery point. That is the end of the dispute - and the beginning of a conversation with the driver based on facts rather than claims.

    Or the opposite: a customer insists the driver never arrived at their premises. Route playback shows the vehicle at the delivery address at the correct time, with a stop of 12 minutes recorded. The proof is unchallengeable and the customer’s complaint is resolved in minutes.

    Both outcomes protect the business. In the first case, you identify a performance issue. In the second, you protect a driver from an unfair accusation and demonstrate to the customer that your record-keeping is reliable.

    Accident Investigation

    When a vehicle is involved in an accident, the first questions are always about speed and position. Route playback answers both immediately.

    Was the vehicle speeding before the collision? The recorded speed at every point along the route is available. Was the driver where they claimed to be? The GPS record is time-stamped and cannot be altered.

    This data is increasingly accepted as evidence in insurance claims and, in some jurisdictions, in legal proceedings. Having it available does not guarantee a favourable outcome, but not having it means you are arguing your driver’s version against the other party’s version - with no objective record to refer to.

    Driver Coaching

    Route playback is one of the most effective tools for driver coaching precisely because it is objective. When you sit with a driver and show them the route on screen - pointing to a harsh braking event on a specific road, showing them the speed graph approaching a roundabout - the conversation is grounded in evidence rather than impressions.

    Drivers respond better to this than to abstract feedback. Telling a driver they brake too hard is vague. Showing them the specific moment on a specific day, explaining the speed differential, and asking what was happening at that point is a productive conversation.

    Scenario: Unexplained Mileage

    A common use case for route playback is mileage that does not add up. A driver submits a daily mileage log that shows 180 kilometres. The Trips report shows 230 kilometres. Where did the extra 50 kilometres go?

    Route playback shows exactly where. The discrepancy might be a legitimate job the driver forgot to log. It might be a personal trip. It might be a detour that added distance without any commercial purpose. Knowing which of these it is determines the right response.

    How Far Back Does History Go?

    Fleetile stores complete trip history for all vehicles. You can replay any trip from any date - not just recent ones. This is useful for month-end reviews, quarterly audits, or investigating a complaint that was raised weeks after the incident.

    Use the date range picker in the Playback section to select any vehicle and any date. All trips for that vehicle on that date appear in the timeline. Select the one you want and press play.

    The Shift in How You Manage

    Operators who use route playback regularly describe the same change in their management approach: they stop relying on driver-submitted information for anything that can be verified independently. Not because they distrust their drivers, but because having an objective record removes ambiguity from every conversation.

    Drivers also know the record exists. That knowledge alone changes behaviour - not through surveillance, but through accountability. When people know that what they do is recorded accurately, they tend to do it more carefully.

    Route playback is not a disciplinary tool. It is a clarity tool. And clarity, in fleet management, is worth more than almost anything else.

    Frequently asked questions

    What does route playback actually show?

    It replays the exact route second by second, with the speed at every point, the time spent at each stop and its address, and the full timeline from engine start to engine stop. Harsh braking, rapid acceleration and speed violations are marked on the route itself.

    Can I control the speed of the playback?

    Yes. At 1x you watch the trip in real time, and at 8x you can review a full day of driving in minutes. You can pause at any point and examine the map position, the speed and any events at that exact moment.

    How does route playback settle a customer dispute?

    When a customer says a delivery arrived late or never arrived, you replay the trip and see exactly when the vehicle reached the address and how long it stayed. The answer comes from the record rather than from anyone’s recollection.

    Is route playback only useful after an accident?

    No. An aircraft black box is only examined after a disaster, but route playback is something you use every week, for coaching, for dispute resolution and for performance review.

    Does it show where harsh driving happened?

    Yes. Harsh braking, rapid acceleration and speed violations are plotted on the route, so you can see the place and the moment each one occurred instead of only a count at the end of the day.