Every fleet platform claims to do it all, but the gap between a tool you rely on every day and one that gathers dust comes down to a handful of capabilities. This guide walks through the 12 fleet management software features that actually earn their keep in 2026, what each one does, what “good” looks like for each, and how to tell a genuine feature from a marketing bullet point.
The short answer
If you only remember four things, remember these. Live GPS tracking that refreshes in seconds is the foundation everything else sits on. Geofencing and smart alerts are what turn a map you have to watch into a system that tells you when something is wrong. Driver scoring is where the safety and fuel savings come from. Trip history and reports are what let you prove any of it happened.
Everything else on this list is valuable, but those four decide whether the software gets used after the first month. The rest of this guide covers all 12 in detail, then breaks down which ones matter most for your fleet size and your industry.
The 12 must-have fleet management software features
Use this list as a scorecard. If a platform is missing two or more of these, it’s worth looking harder before you commit. If you’re new to the category, our primer on what fleet management is sets the context first.
| Feature |
What it does for you |
| 1. Live GPS tracking |
See every vehicle’s position, speed and heading in real time |
| 2. Geofencing |
Draw zones and get alerts on entry or exit |
| 3. Remote engine cut |
Immobilise a stolen or misused vehicle remotely |
| 4. Driver scoring |
Grade driving behaviour to cut accidents and fuel waste |
| 5. Trip history & reports |
Replay routes and turn raw data into decisions |
| 6. Smart alerts |
Instant notifications for speeding, idling, breaches and more |
| 7. Speed camera alerts |
Warn drivers before fixed cameras to avoid fines |
| 8. Mobile apps |
Full control from iOS and Android, not just a desktop |
| 9. Managed hardware |
Device, SIM and installation handled for you |
| 10. Fuel & mileage insight |
Spot waste, idling and unauthorised trips |
| 11. Multi-vehicle dashboard |
One live map for the whole fleet |
| 12. Asset tracking |
Monitor trailers, generators and non-powered assets |
1. Live GPS tracking
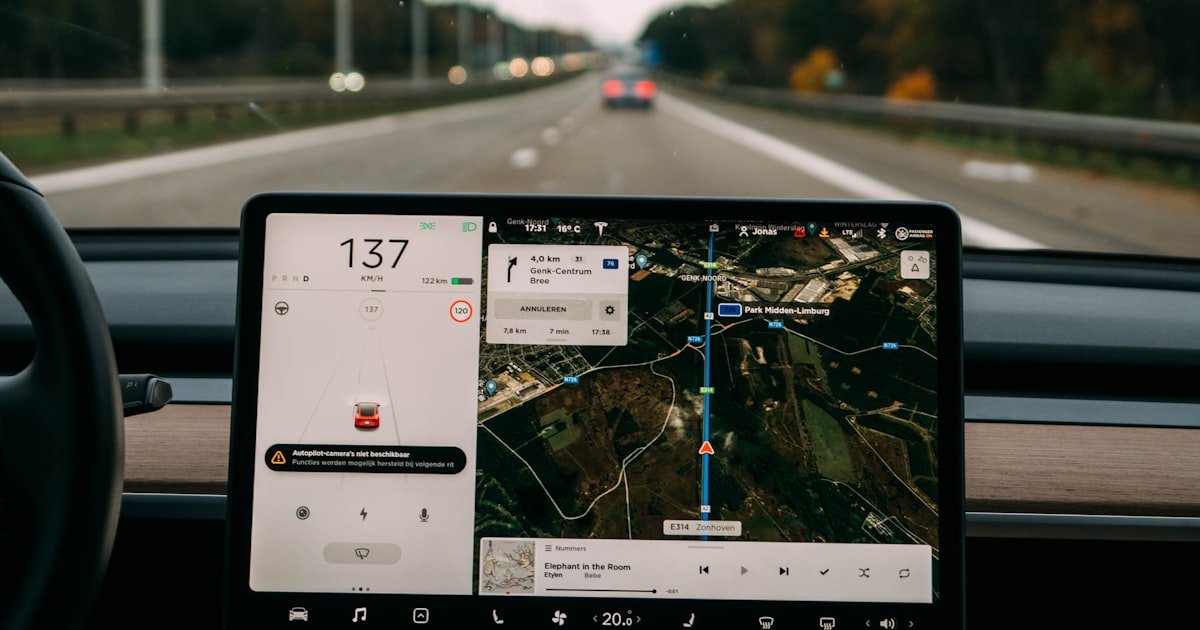
This is the foundation. The best systems update location every few seconds rather than every few minutes, so the map reflects reality. Frequent updates are what make live dispatch, theft recovery and accurate reporting possible. If updates are slow, everything built on top of them is slow too.
What good looks like: position, speed, heading and ignition state for every vehicle, refreshed in seconds, with the current address and a last-seen time when you click a vehicle. The map should stay accurate when a vehicle is parked, not drift around a stationary point.
What to ask: how often does the position update while moving, and how often while stopped? Many platforms quietly slow down when a vehicle is idle, which is exactly when theft happens. Our comparison of real time versus passive GPS tracking explains why the difference matters more than the marketing suggests.
2. Geofencing
Geofencing lets you draw virtual boundaries on the map, such as a depot, a customer site or a restricted area, and get an alert the moment a vehicle enters or leaves. It’s the backbone of both operations (confirming arrivals) and security (catching out of hours movement).
What good looks like: unlimited zones in any shape, not just circles, with separate rules for entry and exit, and the ability to apply a zone to one vehicle, a group, or the whole fleet. Time based rules matter too, so a depot can be allowed during working hours and alerted on overnight.
What to ask: can a zone be scheduled, and can different drivers have different permissions for the same zone? Our guide to geofencing for fleets covers the setups that work in practice.
3. Remote engine cut / immobiliser
The single most effective anti theft feature. Tracking tells you a vehicle has been stolen; a remote immobiliser lets you cut the engine and stop it. For anyone weighing theft risk, this is the feature that changes the outcome.
What good looks like: the command reaches the vehicle over more than one channel so it still works where mobile data is weak, it refuses to engage above a safe speed, and every command is logged with who sent it and whether it succeeded.
What to ask: what happens if the command fails, and is there a retry? A command console with no delivery status is a feature you cannot rely on in the moment you need it. See how remote immobilisers work in practice for the full picture.
4. Driver scoring
Driver scoring turns raw behaviour such as speeding, harsh braking and sharp cornering into a simple score per driver. That makes coaching objective and measurable, and safer driving directly lowers accident and fuel costs.
What good looks like: a score you can explain to a driver, built from events they can recognise, with a trend over time rather than a single number. A score nobody understands gets argued with instead of acted on.
What to ask: can the thresholds be tuned per vehicle type? A loaded truck and a light van should not be judged on the same braking force. Our guides to driver behaviour monitoring and building accountability without micromanagement go deeper on using scores well.
5. Trip history and reports
Being able to replay any journey and pull clear reports is what turns tracking data into decisions. Look for route playback, mileage summaries and reports you can actually act on rather than raw data dumps.
What good looks like: playback that shows stops, idle time and speed along the route, and reports you can schedule to arrive by email instead of remembering to run them.
What to ask: how far back does history go, and does it cost extra to keep it? Retention is where quoted prices often change. See what route playback gives you and how to act on fleet reports.
6. Smart alerts
Good platforms ship dozens of configurable alerts covering overspeeding, idling, geofence breaches, harsh driving, device offline and more. Fleetile includes 30+ smart alerts so exceptions come to you instead of you hunting for them.
What good looks like: per vehicle and fleet wide thresholds, delivery to more than one channel, and the ability to switch an alert off for a group without deleting it. Alerts you cannot tune become noise, and noisy alerts get ignored within a fortnight.
What to ask: who receives each alert, and can that differ by alert type? Our post on overspeeding alerts shows how to set thresholds that people keep paying attention to.
7. Speed camera alerts
In cab warnings before fixed speed cameras help drivers stay compliant and avoid fines. It’s a small feature that quietly protects both your safety record and your budget.
What good looks like: a camera database that covers the countries you actually operate in and gets updated, rather than a list that shipped once and was never touched again.
8. Mobile apps for iOS and Android
You’ll manage the fleet from your phone more often than your desk. Full featured iOS and Android apps with the live map, alerts and remote commands on the go are non negotiable in 2026, not a “nice to have.”
What good looks like: the app does what the web dashboard does. A read only phone app that forces you back to a laptop to change anything is a viewer, not an app.
What to ask: can drivers get their own limited login, separate from the manager view? Many fleets need both, and bolting that on later is painful.
9. Managed hardware
The device, SIM and professional installation are as important as the software. A managed provider supplies and fits everything, so there’s no juggling separate hardware and connectivity vendors. This is often the difference between a rollout that takes a day and one that drags on for weeks.
What good looks like: one contract covering device, connectivity, fitting and replacement, with a clear answer on who comes out when a unit fails.
What to ask: is the tracker locked to this provider? A device you cannot move is a switching cost disguised as a feature. Our guide to choosing a GPS tracking device and the comparison with OBD2 trackers cover the trade offs.
10. Fuel and mileage insight
Tracking idling, mileage and unauthorised trips exposes waste you can’t see on paper. It’s one of the fastest ways the software pays for itself. See our post on cutting fleet costs for practical tactics.
What good looks like: idle time separated from engine on time, private trips separated from business trips, and a fuel view that flags sudden drops rather than only totalling consumption.
What to ask: does fuel data come from the vehicle or from an estimate? Both are useful, but they answer different questions. See fleet fuel monitoring, reducing fuel theft and reducing idling.
11. Multi-vehicle live dashboard
A single map showing the whole fleet at a glance, who’s moving, who’s parked, who’s off route, is where daily operations actually happen. It should stay smooth whether you run 5 vehicles or 500.
What good looks like: filtering and grouping that survives a growing fleet, so the map is still usable at 200 vehicles. Test this with your real fleet size, not the demo account’s eight vehicles.
12. Asset tracking
Vehicles aren’t your only mobile investment. The ability to track trailers, generators and other non powered assets on the same dashboard keeps everything in one view instead of scattered across tools.
What good looks like: long battery life on unpowered units and the same alerting rules as vehicles. See asset tracking systems and trailer and container tracking.
Which features matter most for your fleet size
The same checklist does not carry the same weight at every size. Buying the enterprise feature set for six vans is how software ends up unused.
| Fleet size |
What actually matters |
What can wait |
| 2 to 10 vehicles |
Live tracking, remote engine cut, a mobile app, and managed installation. At this size the owner is usually the fleet manager, so the phone app is the product. |
Driver scoring leagues, deep reporting, asset tracking |
| 11 to 50 vehicles |
Geofencing and alerts become essential, because nobody can watch the map all day. Driver scoring starts paying back. Trip history matters for customer disputes. |
Multi depot grouping, API integrations |
| 50+ vehicles |
Grouping, permissions and scheduled reports, so information reaches people without anyone logging in. Fuel and maintenance insight compound at this size. |
Little. This is where the full checklist earns out. |
If you’re at the smaller end, our guide to fleet management for small businesses covers what to prioritise, and what fleet GPS tracking costs sets expectations on budget.
Which features matter most in your industry
Two fleets of the same size can need completely different things from the same platform.
Features you can safely add later
A shorter list than vendors suggest, but worth naming so you don’t pay for it on day one. Maintenance scheduling, inspection checklists, KPI dashboards and EV specific reporting are all genuinely useful, and all of them are easier to adopt once the basics are running and people trust the data. Starting with everything switched on is the most common reason a rollout stalls.
When you’re ready for them, see fleet maintenance management, vehicle inspection checklists, fleet management KPIs and EV fleet management.
How to separate real features from marketing
Feature lists are easy to write; working features are harder to build. A few ways to pressure test a vendor:
- Ask to see it live. Beware polished renders, and insist on a demo running on real vehicles.
- Check update frequency. “Real-time” should mean seconds, not minutes, and it should still mean seconds when the vehicle is parked.
- Test the mobile app. If the phone experience is thin, you’ll feel it every day.
- Confirm who builds it. A platform maintained in house gets fixed and improved faster than a resold third party system.
- Ask what is not included. Data retention, extra users, additional alert types and hardware replacement are the four things most often priced separately.
- Check it at your size. A dashboard that is pleasant with eight demo vehicles can be unusable with two hundred.
Questions worth asking on the demo call
- How often does a vehicle’s position update while moving, and while parked?
- How long is trip history kept, and what does it cost to keep it longer?
- Can alert thresholds differ per vehicle or per group?
- Does the mobile app do everything the web dashboard does?
- Who installs the hardware, and who replaces it when it fails?
- Is the tracker locked to your platform?
- How many users are included, and what does an extra one cost?
- Can I see this running on a fleet the size of mine?
How Fleetile maps to the checklist
Fleetile was built to cover this full list: live GPS tracking updated every few seconds, geofencing, remote engine cut, driver scoring, trip history and reports, 30+ smart alerts, speed camera warnings, full iOS and Android apps, and managed hardware with the device, SIM and installation included. Because it’s built and maintained in house, there’s no second vendor to chase when you need something fixed.
Frequently asked questions
What are the most important fleet management software features?
Live GPS tracking, geofencing, smart alerts, driver scoring and trip history. Those five decide whether the software is used daily. Remote engine cut becomes the most important feature the day a vehicle is stolen, and mobile apps decide whether the system is usable away from a desk.
What features does a fleet management system include?
A complete system covers vehicle location and status, zone rules, alerting, driver behaviour, historical trips and reporting, remote commands, mobile access, and the hardware that feeds it. Broader platforms add maintenance scheduling, inspections, fuel monitoring and asset tracking on the same dashboard.
What capabilities should fleet management software have at minimum?
At minimum: a live map that refreshes in seconds, alerts you can configure, history you can replay, and a mobile app that does the same job as the desktop. Anything that fails one of those four will be worked around rather than used.
Are the features different for a car fleet?
The core set is the same. Car fleets tend to lean harder on driver scoring, private versus business trip separation and mileage reporting, while truck and plant fleets lean on fuel monitoring, asset tracking and maintenance. The platform should handle both without a separate product.
Do I really need remote engine cut?
If theft is a real risk in your area or your vehicles are high value, yes. It’s the difference between tracking a stolen vehicle and stopping it. If your vehicles are always in secure yards and low value, it’s the feature you can most safely rank lower.
Are mobile apps essential in fleet management software?
Yes. Most fleet decisions happen away from a desk, and a platform that only works properly on desktop quietly stops being checked. Confirm the app can send commands and change settings, not only display a map.
How many alerts should good fleet software include?
Enough to cover speeding, idling, geofence entry and exit, harsh driving, tampering, power loss and device offline at a minimum. Fleetile includes 30+ alert types. The number matters less than whether you can tune thresholds and choose who receives each one.
How many features should I switch on when I start?
Start with live tracking, one or two geofences and a small set of alerts. Add driver scoring once people trust the map, and reporting once you know which question you want answered every week. Fleets that enable everything on day one usually end up ignoring all of it.
See the features in action
The fastest way to judge a platform is to watch it work. Get a Fleetile demo and see live tracking, geofencing, driver scoring and alerts running on real vehicles, then check them off against this list yourself.